How to Monitor your Java Application’s JVM
A quick guide to monitor your Java applications JVM’s and Garbage Collection in Java 11 using VisualVM
It’s a very common requirement to have to monitor a remote running Java application’s JVM. You may need to see how the CPU is performing or monitor the threads. Also common, is to monitor the JVM’s Garbage Collection for a JVM tuning or problem diagnosis exercise.
Each time I need to do this I seem to end up down the rabbit hole trying to remember how I solved the problem last time. So I thought I might document this here for future use. I hope this helps us both!
There are quite a few tools you might use for these tasks but today I’ll be using VisualVM.
VisualVM setup
Download the latest Standalone Visual VM from here.
I’m setting this up on my Mac, if you have another OS then follow the relevant instructions.
For simplicity I used the MacOS Application Bundle (.dmg) so after install I open the application and I’m ready to go!
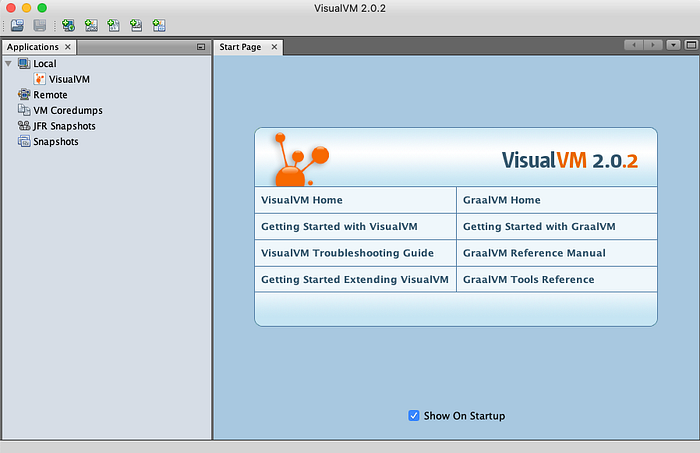
I know ahead of time that I want to monitor my JVM Garbage Collection so I’ll add the Visual GC plugin.
To do this, go to Tools -> Plugins -> Available Plugins and I select Visual GC, then Install. Follow the prompts to install the plugin.

JVM setup
Your JVM will need to be configured to allow connections for monitoring.
JMX
I’m going to make a JMX connection so I’ll need to expose that on my JVM.
Note: It’s important to note that I only need to do this once on the server and after this, I can monitor other Java applications too. i.e In this example I’ll be monitoring a Directory Server. If I then start another Java process i.e. Tomcat, I can then monitor this as well. More on this later.
I’m particularly interested in monitoring my ForgeRock Directory Server so I’ll add the following JVM options:
-Dcom.sun.management.jmxremote-Dcom.sun.management.jmxremote.port=8009-Dcom.sun.management.jmxremote.rmi.port=8009-Dcom.sun.management.jmxremote.ssl=false-Dcom.sun.management.jmxremote.authenticate=false-Djava.rmi.server.hostname=dseval7.example.com
You may wish to tweak these options for your solution, in that case you should follow the relevant JDK documentation.
After this is configured you’ll need to start (or restart) your application.
Monitor the JVM
Let’s configure VisualVM to monitor our JVM over JMX.
Right click on Remote, then Add Remote Host,

Enter the hostname then press OK. You should now have your new server listed under Remote.
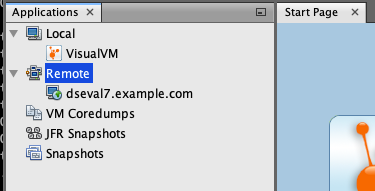
Let’s connect to the JMX port and see what we can see.
Right click on your new server name and select Add JMX Connection

Now enter in your hostname:port number you exposed in your JVM settings i.e. dseval7.example.com:8009. This is non-SSL and authentication is not required for my setup (as per JVM settings above), so I’ll select the appropriate options and press OK.

Once this is complete I can see and monitor the JVM.
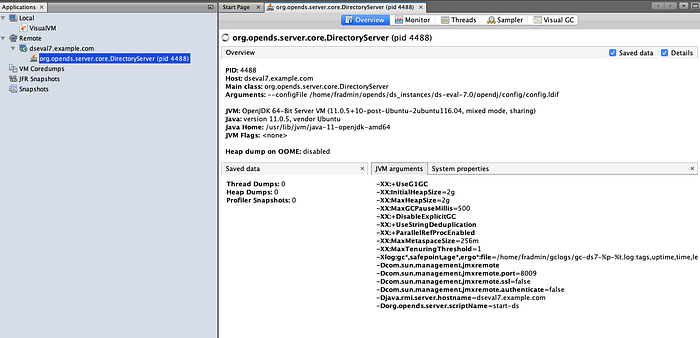
Various useful stats are available to me like CPU, threads, Heap and Metaspace etc
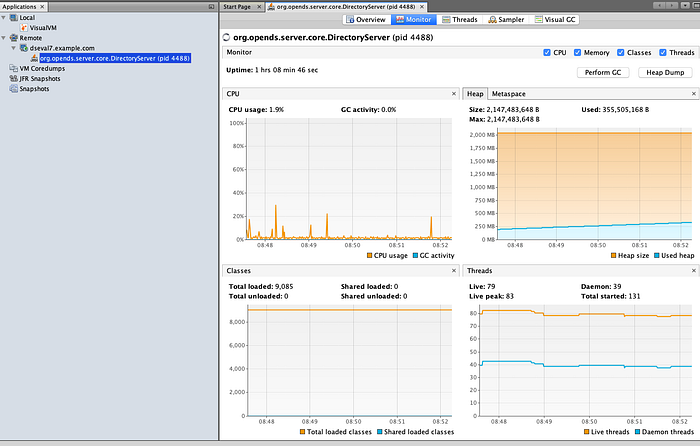
However the Visual GC tab gives me the error : Not supported for this JVM.

This is because the Visual GC plugin uses the jstatd API on the server that has not been started. So let’s set that up.
jstatd setup
You’ll need to setup a security policy first. For Java 11 create a policy file i.e.
vi jstatd-java11.policythen add in the following:
grant codebase “jrt:/jdk.jstatd” {
 permission java.security.AllPermission;
};grant codebase “jrt:/jdk.internal.jvmstat” {
 permission java.security.AllPermission;
};
Java 8 Hint: in Java 8 this is different, in Java 8 you’ll need to point to the tools.jar file i.e.
//Java 8
grant codebase “file:${java.home}/../lib/tools.jar” {
 permission java.security.AllPermission;
};
After you’ve configure your security policy, you’ll need to run jstatd pointing to this file, I’ll do this in the background.
jstatd -J-Djava.security.policy=./jstatd-java11.policy -J-Djava.rmi.server.hostname=dseval7.example.com &Running jps will confirm that the process has started.

Visual GC
Let’s browse back now to VisualVM. You should notice a few more options including the jstatd connection.
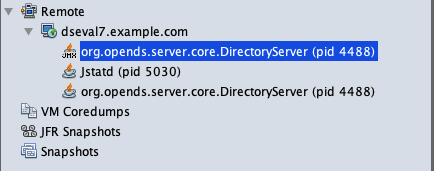
If I now browse to my JMX connection and view the Visual GC tab this should now provide me with the information I’m looking for.
Hint: If this doesn’t automatically appear, then close the old tabs and/or reconnect to the server under the Remote section in VisualVM.

What does all this data mean? well that’s for another time :).
If you want to know more about Garbage Collection, in particular G1 GC the default GC for Java 11, then read my other post JVM Tuning with G1 GC.
Monitoring other Java processes
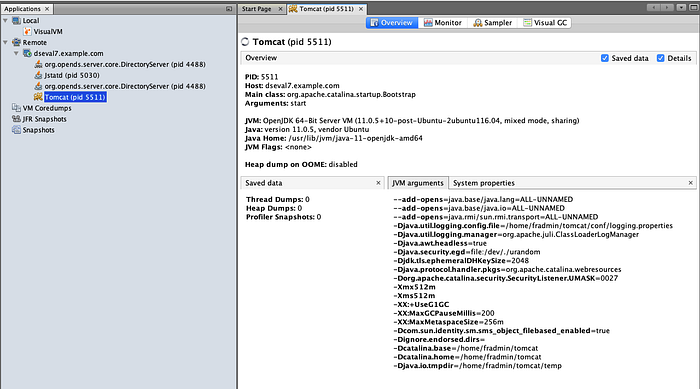
One final note which I mentioned earlier, if I now start another Java process i.e. Tomcat, I can monitor these too. With JMX exposed already as well as jstatd running, I’ve already configured all that is required.
As an example I’ll start tomcat

Voila! Tomcat is now available for monitoring.
Good luck and happy monitoring!
